


Why the midterm results are likely to matter less to a well-built portfolio than the headlines suggest, and why “this time is different” deserves both respect and skepticism.
Every two years, the same question arrives with the yard signs: what will the election do to my portfolio? Control of Congress is uncertain this year. Morgan Stanley expects the House to change hands and considers the Senate a toss-up [1].
For long-term investors, though, the better question is whether the outcome should change their plans. History suggests it rarely does. According to J.P. Morgan, the S&P 500 has delivered positive returns in the 12 months following every midterm election since 1950, with an average gain of about 15% [2].
Why midterm years feel uneasy
Since 1970, the median standard deviation of stock returns in midterm years has been nearly 16%, compared with roughly 13% in all other years [3]. Standard deviation is a measure of volatility, meaning stock returns have historically been about 23% more volatile during midterm years. Also, in midterm years since 1942, the S&P 500 has fallen an average of 18% from peak to trough at some point during the year [4].
One explanation is uncertainty about policy, rather than which party ultimately wins. LPL Research notes that post-election gains have typically been driven by declining uncertainty and greater clarity about policy rather than by which party won or lost [3].

Figure 1. From 1950 through 2025, the midterm year produced the lowest average S&P 500 return of the four-year cycle, and the year after it produced the highest (author’s calculation) [5].
What happens after the votes are counted
Since 1938, the S&P 500 has posted price gains in the 12 months after a midterm 95% of the time [6]. Measured by calendar year, the index delivered a positive total return in the year following every midterm from 1950 through 2022, averaging 20.8% [5]. Shorter windows look similar: since 1970, the S&P 500 has averaged a 14.1% return in the six months immediately after midterms [3].

Figure 2. The S&P 500 finished higher in the calendar year after all 19 midterm elections from 1950 through 2022 [5].
Why gridlock tends to suit markets
Divided government is more of the norm than the exception. Every president since Bill Clinton has seen his party lose control of at least one chamber of Congress during a midterm election [7]. From 1953 through 2024, Washington operated under divided control 64% of the time [8].
Why might a stalemate be constructive for markets?
- Fewer surprises. Divided governments can reduce the probability of sweeping policy changes, making the environment easier for businesses and investors to plan around [6].
- A narrower agenda. Negotiations between Congress and the White House would likely be confined to must-pass items such as the budget and the debt ceiling, which is expected to resurface in 2027 [9].
- Neutral has not meant negative. In CNBC’s analysis of elections from 1980 through 2024, single-party outcomes averaged an 11.5% gain over the following year [10].
If control of Congress changes hands
A Congress controlled by one party and a White House occupied by the other is a familiar arrangement. The outcome forecasters are discussing for this year, a Democratic House and Senate alongside a Republican president, also followed the 1954, 1958, 1970, 1974, 1986, 1990, and 2006 midterms. In each case, the S&P 500 posted a positive total return the following calendar year, averaging about 19.6% [5].
Results immediately after the vote have been more muted. After the 1986, 1990, and 2006 midterms, the S&P 500 dipped an average of 0.5% on the day after the election but was up 3.4% a month later and 10.9% a year later [10].
Over longer stretches, the record is more mixed. From 1953 through 2023, that same configuration produced the lowest average annual price return of the six combinations RBC studied, at 4.9%, although every combination produced a positive average [8]. Those periods include the 1973–1974 bear market and the 2008 financial crisis, which were driven largely by oil shocks, inflation, and a housing collapse. As Morningstar puts it, correlation does not equal causation [7].
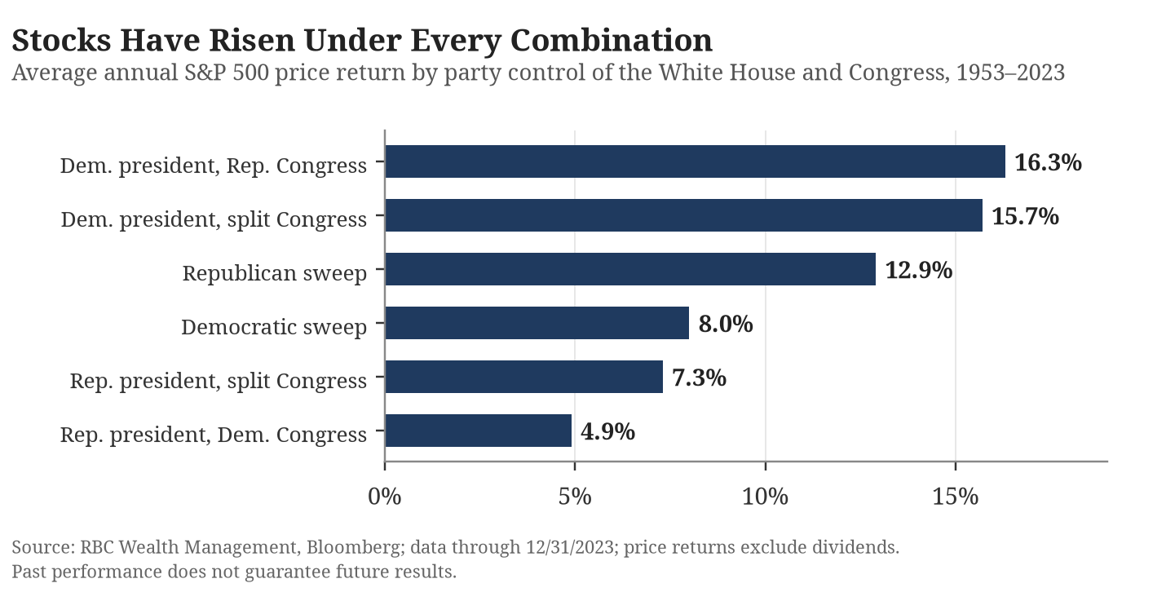
Figure 3. Average annual S&P 500 returns have been positive under every combination of party control since 1953 [8].
Each outcome brings a different set of headlines to watch:
Possible outcome | What markets may focus on |
President’s party loses both chambers | Negotiations likely confined to must-pass items such as the budget and the debt ceiling. |
Congress is split | A higher risk of government shutdowns and debt-limit brinkmanship. |
President’s party keeps both chambers | Single-party outcomes have averaged an 11.5% gain over the following year [10]. |
It’s always true until it isn’t
Streaks end. The last time U.S. stocks declined in the 12 months after a midterm was 1946 [4]. Even the year after a midterm has ranged from a gain of just 1.4% in 2015 to 37.2% in 1995 [5]. And in the eight midterm cycles since 1930 when the president’s party lost the House, the S&P 500 rose for the remainder of the year only five times, according to Ned Davis Research [9].
That said, today's market has a few features worth watching:
- Valuations are stretched. The S&P 500’s cyclically adjusted price-to-earnings ratio stands at 40.7, well above the previous midterm-year high of 33.8 in October 1998 [4].
- Leadership is narrow. Just five stocks accounted for more than half of the S&P 500’s return in the first nine months of 2026 [4].
Nineteen midterms is a small sample, and each unfolded against a different backdrop of inflation, interest rates environments, corporate earnings, and geopolitical climates.
Don't run for the hills, but don't sprint toward the headlines
Positioning a portfolio around an election means being right twice: once on the outcome and again on how markets react. In 2018, the House changed hands and the Federal Reserve raised rates four times; the S&P 500 ended the year with a 6.2% price decline, yet it was up 11.7% a year after the election [10].
Our guidance is to stay invested, remain diversified, and focus on the longer-term drivers of returns rather than trying to trade around the election. The disciplined middle ground looks like this:
- Revisit the plan, not the polls. Your time horizon, spending needs, and risk tolerance did not change on Election Day.
- Keep near-term cash needs funded. A reserve for upcoming expenses can help you avoid having to sell investments during a market decline.
- Rebalance with intention. After a strong run in stocks, trimming back to target weights reinforces discipline without making a political call.
- Volatility is part of the process. Short-term swings are the price of admission for stocks' long-term growth, and periods of decline have historically set the stage for future gains.
Elections decide who writes the laws, but earnings, interest rates, and time in the market have mattered far more to long-term wealth.The best response to November 3rd is the same one that works every other month: an individualized, disciplined plan built to weather any outcome.
Sources
1. Morgan Stanley Wealth Management, Monica Guerra, “2026 Midterms: Seven Questions That Matter for Markets,” Oct. 27, 2026. https://www.morganstanley.com/insights/articles/2026-election-market-impact-investor-guide
2. J.P. Morgan Asset Management, Jordan Jackson, “How do markets perform post-midterms?” Oct. 7, 2026. https://am.jpmorgan.com/us/en/asset-management/adv/insights/market-insights/market-updates/on-the-minds-of-investors/how-do-markets-perform-post-midterms/
3. LPL Financial Research, Marc Zabicki, “How Investors Can Prepare for U.S. Midterm Elections,” Oct. 2026. https://www.lpl.com/research/street-view/investor-preparation-for-u-s-midterm-elections.html
4. Financial Times, “S&P 500’s perfect midterm record faces a test in 2026,” Nov. 2, 2026 (republished by Yahoo Finance). https://finance.yahoo.com/markets/stocks/articles/p-500-perfect-midterm-record-050010529.html
5. Aswath Damodaran, NYU Stern School of Business, “Historical Returns on Stocks, Bonds and Bills,” updated Jan. 5, 2026. https://pages.stern.nyu.edu/~adamodar/New_Home_Page/datafile/histretSP.html
6. Fidelity Investments, “How might midterm elections impact the stock market?” Fidelity Viewpoints, Oct. 26, 2026. https://www.fidelity.com/learning-center/trading-investing/the-surprising-truth-about-midterms
7. Morningstar, Dan Lefkovitz, “Stocks Climb Higher During Election Months. Does It Matter Who Wins?” Oct. 21, 2026. https://www.morningstar.com/markets/stocks-climb-higher-during-election-months-does-it-matter-who-wins
8. RBC Wealth Management, Kelly Bogdanova, “No free rein: The realities of U.S. presidential power,” Aug. 26, 2024. https://www.rbcwealthmanagement.com/en-us/insights/no-free-rein-the-realities-of-us-presidential-power
9. Reuters, Saqib Iqbal Ahmed and Gertrude Chavez-Dreyfuss, “Analysis: Investors Gaming Out Congress Control for Spending, AI Outlook,” Nov. 2, 2026 (republished by U.S. News & World Report). https://www.usnews.com/news/politics/articles/2026-11-02/analysis-investors-gaming-out-congress-control-for-spending-ai-outlook
10. CNBC, Deena Zaidi, “Stock market after midterm elections: What S&P 500 history shows,” Nov. 2, 2026. https://www.cnbc.com/2026/11/02/stock-market-after-midterm-elections-sp-500-history.html
This article is for informational and educational purposes only and should not be considered investment, tax, or legal advice. Past performance does not guarantee future results. Index returns are unmanaged, do not reflect fees or expenses, and cannot be invested in directly. Charts were prepared by the author using the published data cited above.